The worst local AI failure is not the loud one.
A loud failure is easy. The model server is down. The GPU runs out of memory. Docker refuses to start. A workflow throws a stack trace. You know something broke.
The quiet failure is nastier. A local agent reads the wrong file, skips a tool call, retries the same prompt three times, falls back to a smaller model, or produces a confident answer from half the context. The automation still returns text, so it looks alive. You only notice later when the answer is bad, the job took forever, or a private document was sent into a log you never meant to keep.
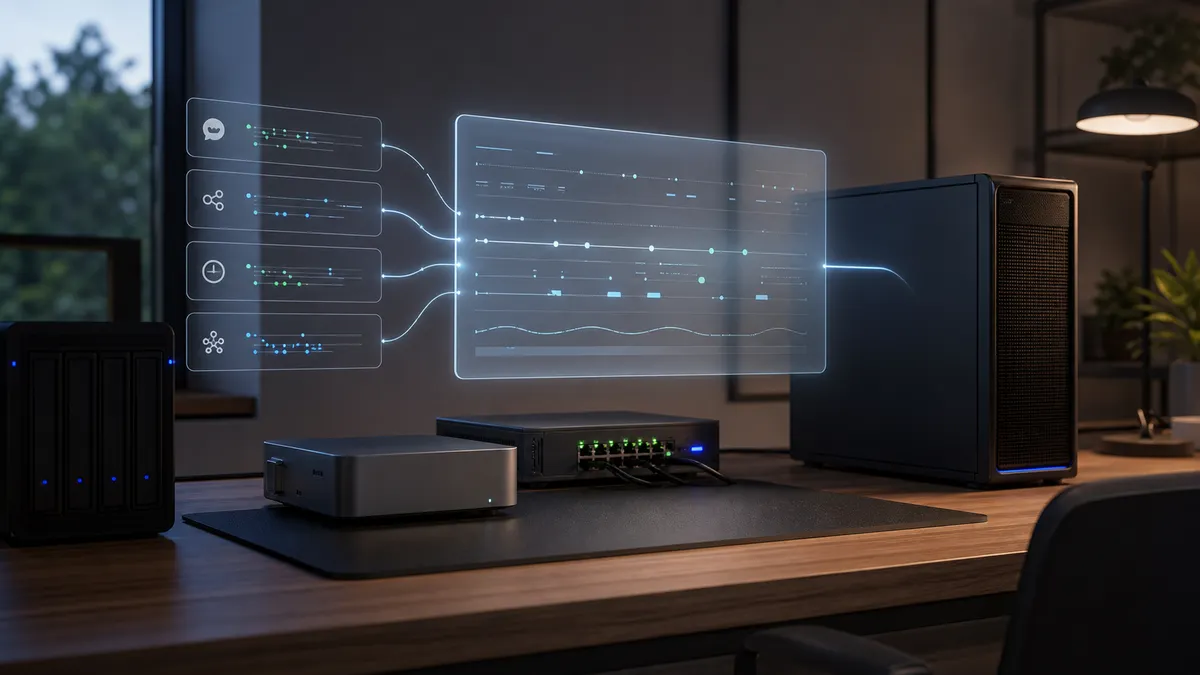
That is why prompt tracing belongs in a practical local AI lab. Not enterprise observability. Not a giant dashboard you maintain for sport. Just enough tracing to answer: what prompt ran, which model answered, how long it took, which tool steps happened, what failed, and what sensitive data should never leave the application.
This is researched home-lab guidance for July 4, 2026, not a TokenByte benchmark or hands-on review of Langfuse, LiteLLM, OpenTelemetry, Ollama, Docker, a Mac Mini, or an RTX workstation. TokenByte has not measured trace ingestion overhead, database growth, dashboard performance, or reliability for the setup described here. Treat this as a practical planning guide, then test it with your own clients, models, documents, retention rules, and network layout.
Affiliate disclosure: TokenByte may earn a commission when you buy through links on this site. That does not change the recommendation here: start with the hardware you already have. Buy a mini PC, Mac Mini, SSD, NAS, RAM, GPU, or networking gear only after traces show that storage, memory, compute, or uptime is actually the bottleneck.
The short version
Prompt tracing gives your local AI lab a flight recorder.
For each useful run, capture:
- the workflow or automation name
- the client-facing model alias
- the real backend model when you can log it safely
- start time, end time, and error status
- prompt and response size
- tool calls or retrieval steps
- Ollama or backend timing fields when available
- redaction status
- a trace link or trace ID you can paste into a bug note
Do not start by logging every byte forever. Start with one automation, one local gateway or model endpoint, and one private trace store. Keep it LAN-only unless you have a serious reason to do otherwise.
If you are still deciding which machine should run always-on services, start with the TokenByte build picker. The Mac Mini local AI guide is useful for quiet control-plane roles, the ComfyUI GPU guide keeps GPU expectations grounded, the recommended gear hub is where buying decisions should land, and TokenByte's how we test page explains why measured evidence should stay separate from researched setup advice.
Why local AI needs traces
Local AI feels private, but privacy is not the same thing as visibility.
A folder-watching script might summarize files locally with Ollama. A small agent might call a tool, write a note, then ask a second model to clean the output. A ComfyUI helper might describe generated images and rename files. A RAG prototype might retrieve chunks from a local vector database before asking a model to answer.
When those systems are small, terminal logs are enough.
Then the lab grows. The logs are scattered across cron, Docker, a desktop app, a notebook, and a gateway. Some requests stream. Some fail halfway. Some silently retry. Some use one model alias today and another tomorrow. A bad answer becomes hard to investigate because the evidence is split across machines and scrollback buffers.
A trace ties the run together.
In OpenTelemetry terms, a trace is built from spans. A span represents one unit of work, and spans can nest under other spans. That shape maps neatly to local AI:
- parent span: nightly document cleanup
- child span: scan folder
- child span: extract text
- child span: retrieve related notes
- child span: call local model
- child span: validate JSON
- child span: write result
You do not need to care about every standard on day one. The useful idea is simple: one run gets one trace ID, and every important step hangs under it.
Do not trace everything first
The first mistake is trying to build a perfect observability platform before you know what you need.
Pick one annoying workflow. Good candidates are:
- a local agent that uses tools
- a RAG workflow that sometimes answers from weak context
- a note or document summarizer
- a ComfyUI helper that submits jobs or renames outputs
- a gateway-backed automation that routes between models
- a daily job that matters enough to debug
Leave the rest alone for now.
The first tracing pass should answer practical questions:
- Did the automation use the expected model?
- Did it call the tool it was supposed to call?
- Did retrieval return useful context or junk?
- Did the prompt get too large?
- Did the model response pass validation?
- Did it retry?
- Did it fall back to a slower machine?
- Did it log private content that should be masked?
That is already a lot of value.
The goal is not to make a dashboard look impressive. The goal is to stop guessing when a local AI workflow behaves strangely.
Where Langfuse fits
Langfuse is one reasonable open source option for LLM observability because it is built around traces, prompt management, evaluations, and LLM application debugging.
Its self-hosting documentation says Langfuse can be self-hosted with Docker and that low-scale deployments can run on a VM or locally with Docker Compose. The same documentation is clear that this low-scale path is for testing and lacks high-availability, scaling, and backup capability.
That distinction matters for a home lab.
For a first local AI tracing setup, a low-scale deployment can be enough to learn. It lets you see whether traces are useful before turning observability into another production system. If the trace store becomes important, you need to treat it like real infrastructure: backups, upgrades, storage planning, access control, and a recovery plan.
The current Langfuse self-hosting architecture is not just one tiny container. The documentation describes application containers plus storage components including Postgres, ClickHouse, Redis or Valkey, and S3-compatible blob storage for incoming events, multimodal inputs, and large exports. That does not mean you should panic. It means you should not casually run it on the same fragile box as everything else and assume the data will take care of itself.
For a home lab, a sensible first role is:
- run the trace system on the always-on control-plane machine
- keep it LAN-only
- give it a predictable hostname
- keep its data volume on reliable storage
- back it up if traces become operationally important
- keep a retention policy instead of hoarding prompts forever
If your lab already has a quiet Mac Mini or mini PC acting as a control plane, prompt tracing is a natural fit. The GPU workstation can stay focused on inference and image generation.
LiteLLM makes gateway logging easier
If your apps already go through a local AI gateway, that gateway is a good place to add tracing.
LiteLLM's Langfuse integration documentation describes Langfuse as an open source LLM engineering platform for model tracing, prompt management, and application evaluation. The same page shows LiteLLM callback patterns for sending successful and failed LLM calls to Langfuse, and it notes that Langfuse v3 users should use the Langfuse OpenTelemetry integration.
The practical home-lab point is not that LiteLLM is mandatory. It is that a gateway gives you one instrumentation point instead of ten.
Without a gateway, every automation needs its own tracing code. That is fine for a serious app, but annoying for quick scripts. With a gateway, you can start by tracing model calls centrally, then add richer app-level spans later for workflows that need them.
A useful first split is:
- gateway trace: model name, route, timing, status, request size, response size
- app trace: workflow name, file count, retrieval count, tool steps, validation result
The gateway can tell you that the model call was slow. The app trace can tell you why the call existed in the first place.
Do not hide behind gateway logs alone. If a RAG workflow retrieved the wrong notes, the model call may look healthy while the workflow is still wrong. The trace needs enough context to show the real failure point.
Use Ollama timing fields as evidence
Ollama's API documentation is useful because final response objects include timing and token fields.
The documented final response can include total_duration, load_duration, prompt_eval_count, prompt_eval_duration, eval_count, and eval_duration. The documentation also says durations are returned in nanoseconds and gives the generation-speed calculation: divide eval_count by eval_duration, then multiply by one billion.
Those fields are not a full benchmark by themselves, but they are excellent trace attributes.
For a local automation, log values like:
| Trace field | Why it helps |
|---|---|
model_alias | Shows what the client asked for |
backend_model | Shows what actually served the request |
prompt_tokens | Flags context bloat |
response_tokens | Explains long generation time |
load_duration | Separates cold start pain from generation pain |
prompt_eval_duration | Helps diagnose long-context slowdown |
eval_duration | Helps compare response generation behavior |
done_reason | Helps catch stops, errors, or truncation |
This is where tracing and benchmarking touch without becoming the same thing.
A benchmark asks, "How fast is this setup under repeatable conditions?" A trace asks, "What happened in this real run?" Both matter, but do not mix them carelessly. A trace from a busy evening automation is not the same as a clean benchmark. It is still valuable because it explains the run the user actually experienced.
Mask before you admire the dashboard
Prompt tracing can create a new privacy problem if you log everything by default.
A local AI workflow may handle document text, filenames, email snippets, call transcripts, invoices, API responses, or family notes. If the trace tool stores raw prompts and outputs, then the trace database becomes sensitive infrastructure.
Langfuse's masking documentation is direct about this: masking lets you control tracing data sent to Langfuse and can redact sensitive information from trace or observation inputs, outputs, and metadata. The current docs recommend mask_otel_spans for new Python SDK setups and show examples that delete prompt and completion attributes or replace sensitive patterns before export.
That is the right mindset for a local lab.
Decide what you are willing to store before you start collecting traces:
- Full prompt and output for a test-only toy workflow.
- Redacted prompt and output for real automations.
- Metadata only for sensitive document or email workflows.
- No trace at all for secrets, credentials, private keys, tokens, or medical and legal material.
For many home-lab automations, metadata-only tracing is enough. You can log the model, tool step, timing, token count, error status, and document type without storing the entire document.
The privacy rule is simple: if you would not paste it into a bug report, think hard before putting it into a trace database.
Keep secrets out of environment sprawl
Tracing tools introduce new keys: public keys, secret keys, database passwords, object-store credentials, and sometimes gateway credentials.
Do not scatter them through compose files, screenshots, shell snippets, or .env files that get copied around casually.
Docker's Compose secrets documentation defines a secret as data such as a password, certificate, or API key that should not be transmitted over a network or stored unencrypted in source code. It also warns that environment variables can be unintentionally exposed and printed in logs. Compose secrets are mounted into containers under /run/secrets/<secret_name> and granted per service.
That does not solve every home-lab secret problem, but it gives you a better default than pasting keys everywhere.
At minimum:
- keep tracing credentials out of Git
- avoid putting real keys in blog screenshots or notes
- use separate keys for experiments and real workflows
- rotate keys when a workflow is retired
- do not store model provider keys in a public-facing dashboard
- document where the secrets live without writing the secrets down
The trace system is supposed to help you debug. It should not become the easiest place to leak operational details.
What the first trace should contain
A good first trace is boring and readable.
Use names a human can understand:
notes.cleanup.dailyrag.answer.localcomfyui.rename_outputsinbox.ocr.summarizegateway.chat.completions
Inside the trace, keep the spans small:
load_configscan_inputretrieve_contextbuild_promptcall_modelparse_jsonwrite_outputnotify
Then attach metadata that helps with debugging:
| Field | Example |
|---|---|
lab.machine | mac-mini-control |
workflow.version | 2026-07-04 |
model.alias | notes-fast |
backend.kind | ollama |
input.count | 12 files |
retrieval.count | 5 chunks |
privacy.mode | metadata-only |
validation.result | passed |
error.kind | json_parse_failed |
Avoid clever names. A tired person should be able to open the trace at midnight and understand what happened.
Trace failures, not just successes
Only tracing successful model calls creates a distorted lab.
The failures are where the value is:
- model server unavailable
- request timed out
- response failed schema validation
- tool call missing
- retrieval returned zero chunks
- prompt exceeded the workflow's budget
- image workflow queued behind a long GPU job
- backend changed without the client expecting it
- output was blocked by your own validation rule
If you are using a gateway or SDK that supports success and failure callbacks, wire both. A clean error trace can save more time than a beautiful success dashboard.
Do not treat every failure as a reason to buy hardware. A timeout might be a model-loading issue. A JSON failure might be a prompt problem. A slow run might be an overloaded storage path. A bad answer might be weak retrieval. Traces help you avoid turning every inconvenience into a GPU purchase.
That is the same discipline behind TokenByte's testing posture: collect enough evidence to identify the bottleneck before writing the shopping list.
Set retention early
Prompt traces can grow quickly.
They also age. A trace from a model you no longer use, a prompt template you rewrote, or a workflow you deleted may not deserve permanent storage. If the trace contains private text, keeping it forever is even harder to justify.
Start with a simple policy:
- keep detailed traces for active debugging
- keep metadata longer than raw prompts
- delete old traces from retired experiments
- export only the small examples you need for docs
- back up traces only if you would actually restore them
This is not just about disk space. It is about reducing the amount of sensitive material your lab has to protect.
If a trace system becomes important enough that you would be upset to lose it, it is important enough to back up and rehearse restore. If it is not important enough to back up, do not pretend the dashboard is a source of truth.
A simple first build
Start with this shape:
one automation
      |
      v
local AI gateway or Ollama client
      |
      +--> local model backend
      |
      +--> local trace store
Keep the first build small:
- One traced workflow.
- One private trace project.
- One model endpoint or gateway route.
- One redaction rule.
- One weekly retention check.
- One note explaining what is safe to log.
Then run three real tests:
- A normal successful request.
- A request with intentionally bad input.
- A request while the backend model is unavailable.
After each run, open the trace and ask:
- Can I see where time went?
- Can I see which model route was used?
- Can I see the failure clearly?
- Can I reproduce the bad run?
- Did any private content land where it should not?
If the answer to the last question is yes, stop adding features and fix masking first.
Where hardware actually matters
Prompt tracing is not usually the heavy part of a local AI lab. The model backend, storage, image generation queue, and indexing jobs are usually more demanding.
Still, hardware can matter once traces become part of daily operations.
A quiet control-plane box can host the gateway, trace collector, dashboards, and small databases. A GPU workstation can host the heavy model and ComfyUI work. A NAS can hold backups and exports, but active databases usually deserve fast local storage unless you have tested the network path carefully.
The buying order should follow evidence:
- If traces show cold starts dominate, look at model loading, storage, and keep-alive behavior.
- If traces show long prompt evaluation, inspect context size and retrieval chunks before buying hardware.
- If traces show the gateway is fine but the GPU queue is blocked, adjust scheduling before adding another box.
- If traces show the trace store itself is slow, move it to better storage or a cleaner host.
- If traces show no bottleneck, do not buy anything yet.
The best purchase is the one that solves a measured annoyance. The second-best purchase is the one you avoided because the traces proved it was not the problem.
The practical payoff
Prompt tracing makes local AI feel less mysterious.
It turns "the agent got weird" into "the retrieval step returned two stale chunks, the prompt doubled in size, the model took thirty seconds to load, and JSON validation failed on the first response." That is a debuggable problem.
It also keeps the lab honest. If you claim a workflow is local, traces can show which endpoint was called. If you claim a model is fast enough, traces can show the real runs. If you claim private documents stay private, masking and metadata-only traces force you to decide what is actually stored.
Start small. Trace one workflow. Mask sensitive fields. Keep it LAN-only. Save the trace ID when something goes wrong. Add more only after the first trace helps you fix a real problem.
A local AI lab does not need a giant observability stack to be useful. It needs a way to remember what happened when the answer looked fine but the workflow was quietly wrong.
Found something that needs correcting? Tell the editor. Research, estimates, and hands-on measurements should be identified in the article. Read our affiliate disclosure.