The first sign of a messy local AI lab is not usually a hard crash. It is a slow response from Open WebUI, a ComfyUI queue that feels heavier than yesterday, an Ollama model that stays loaded longer than expected, or a GPU fan curve that sounds different for no obvious reason.
That is the point where a lot of home-lab AI builders start guessing. Maybe the model is too large. Maybe the container leaked memory. Maybe the NAS is slow. Maybe the GPU is thermally soaked. Maybe the box is fine and the browser tab is lying to you.
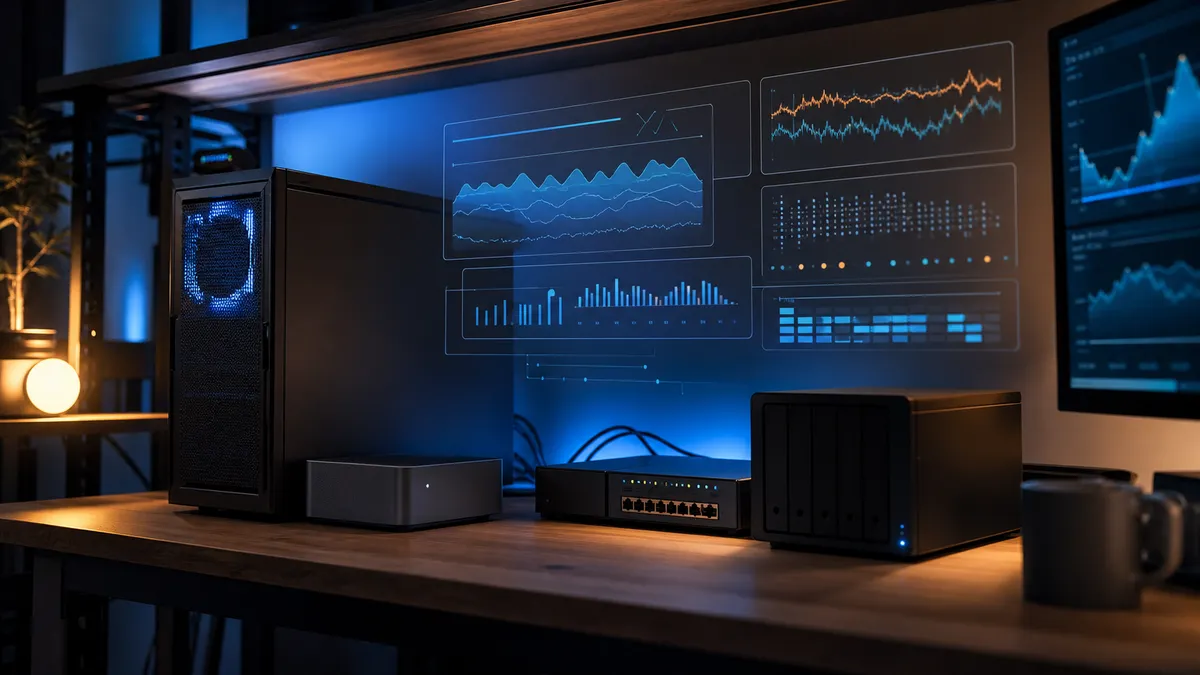
A small local health dashboard turns that guessing game into a short check. It does not need to be enterprise observability. It just needs to show whether the machine is healthy, whether the GPU is available, whether disk and memory are in danger, and whether the AI services you depend on are actually up.
This is a practical dashboard for a home-lab AI stack, not a monitoring vanity project. If you are running Ollama, ComfyUI, Open WebUI, a local API gateway, a vector database, or a handful of automations on one or two machines, this is the layer that helps you stop blaming the wrong part.
Affiliate disclosure: TokenByte may earn a commission when you buy through affiliate links. That does not change the price you pay, and it does not change the practical recommendations here.
What the dashboard should answer
Do not start by installing every exporter you can find. Start with the questions you actually ask when the lab feels off:
- Is the AI box up, reachable, and under load?
- Is the GPU being used, or is the workload stuck somewhere else?
- Is VRAM full, fragmented, or idle?
- Are CPU, system memory, disk, and network normal for this machine?
- Are the Docker containers running?
- Is the model service responding?
- Is storage getting close to full?
- Did the problem start after a container restart, a model download, or a long image run?
That is enough. If a dashboard cannot answer those questions in under a minute, it is too busy for daily use.
For a one-box lab, the clean version is a small Prometheus and Grafana setup on the same host or on your always-on mini PC control plane. Prometheus scrapes metrics. Grafana turns them into a dashboard. Node Exporter exposes Linux host metrics. NVIDIA DCGM Exporter or nvidia-smi based checks cover the GPU side. Simple HTTP checks cover model services like Ollama and local web frontends.
If you already built a mini PC control plane, that is the natural place to run the dashboard. Leave the expensive GPU box focused on inference and image generation. Let the low-power machine watch the lab, keep history, and stay available when the GPU box is rebooting.
Keep the first version boring
The mistake is trying to build a beautiful command center on day one. A useful local AI dashboard starts with boring panels:
- host up/down
- CPU load
- system memory used
- disk space by mount
- disk I/O
- network receive/transmit
- GPU utilization
- GPU memory used
- GPU temperature
- container restart count or uptime
- HTTP health checks for the services you actually use
That may sound plain, but it covers most real failures. A full model drive breaks workflows. A container restart explains a weird half-hour. A GPU stuck at high memory after a failed run explains why the next job will not fit. A high CPU load on the "control plane" mini PC explains why the web UI feels laggy even when the GPU is idle.
This also pairs well with a benchmark log. The benchmark log tells you what "normal" looks like when the lab is healthy. The dashboard tells you when the current run is not normal.
The simple stack
For most Linux-based RTX local AI boxes, the first-pass stack looks like this:
- Prometheus for time-series metrics
- Grafana for dashboards
- Node Exporter for host metrics
- NVIDIA DCGM Exporter for GPU metrics where supported
- a blackbox or simple HTTP check for service reachability
- Docker Compose health checks for the containers you run under Compose
Prometheus' own getting-started docs are still the simplest reference for the scrape model: Prometheus pulls metrics from configured targets on an interval. Node Exporter is the standard Prometheus exporter for Linux host metrics. NVIDIA's DCGM Exporter is the practical route for exporting NVIDIA GPU telemetry to Prometheus in containerized environments. Grafana's Prometheus data source documentation covers the Grafana side of connecting dashboards to Prometheus.
The important part is not the branding of the stack. It is that the pieces are local, boring, and easy to recreate. A dashboard that only works through a cloud account is less useful when you are troubleshooting a LAN, DNS, or router issue. A local-first lab deserves local-first visibility.
Watch the GPU without pretending it is a benchmark
GPU metrics are tempting because they look precise. Treat them as health signals, not as proof of performance.
Useful GPU panels:
- utilization percent
- VRAM used
- temperature
- power draw if exposed by the driver and hardware
- fan speed if exposed
- process list or running containers, when available
Those panels answer practical questions. Is ComfyUI actually using the RTX card? Did Ollama keep a model loaded? Is VRAM still occupied after a failed workflow? Is the card hot before the next batch even starts?
They do not prove that one model is faster than another. They do not replace repeatable benchmarks. They also do not magically explain every latency spike, because image workflows, prompt batching, disk reads, CPU preprocessing, and web UI overhead can all change how a run feels.
If you want performance claims, measure them separately and write them down. If you want an operational dashboard, focus on whether the lab is in a healthy state before, during, and after a job.
Add service checks, not fake AI metrics
Many local AI tools are not designed like production web services. That is fine. You can still check whether the important endpoints respond.
For Ollama, the API documentation includes a running-models endpoint, GET /api/ps, which can be useful for a lightweight local status check. You can also check the base service endpoint or your local OpenAI-compatible gateway if you front Ollama with something like LiteLLM or another proxy.
For ComfyUI, avoid inventing a fake "quality" metric. Start with the basic operational state: is the web service reachable, is the container running, is the GPU visible, is output storage filling up, and does the queue behave the way you expect during a run?
For Open WebUI, your local API gateway, vector database, OCR inbox, or prompt tracing stack, the same rule applies. Check reachability and container health first. Add deeper metrics only when they help you make a decision.
This is where earlier TokenByte builds connect together. A local AI API gateway benefits from a simple health panel because many tools may depend on one endpoint. A prompt tracing setup tells you what the automations did. A health dashboard tells you whether the host and services were in a sane state while they did it.
Put alerts on only the boring failures
Do not alert yourself every time GPU utilization spikes. That is the point of owning a GPU.
Good first alerts are boring:
- root disk over 85 percent
- model or output volume over 85 percent
- AI box unreachable for several minutes
- GPU temperature above your chosen threshold for long enough to matter
- repeated container restarts
- Prometheus cannot scrape a target that should always be up
- control-plane machine is low on disk or memory
The threshold depends on your hardware, cooling, and risk tolerance. Do not copy someone else's numbers blindly. A compact workstation, a rack shelf in a closet, and an open test bench behave differently.
For disks, leave more headroom than you think. Local AI fills storage in ugly chunks: model downloads, generated images, LoRA experiments, logs, Docker layers, temporary files, and workflow outputs. If you wait until a model drive is almost full, the fix is usually more annoying than deleting one file.
This also complements a wall-power check. The wall meter tells you what the system pulls from the outlet. The dashboard tells you what the host and GPU think they are doing. When those two disagree in an interesting way, you have something worth investigating.
Where to run it
There are three sane placements:
- Run it on the AI box.
- Run it on a mini PC control plane.
- Run it on a NAS or always-on server if that machine is already part of the lab.
Running on the AI box is easiest. It is also the least helpful when that machine is rebooting, wedged, or being rebuilt.
Running on a mini PC control plane is usually better. The dashboard stays up while the GPU box restarts. It can watch more than one machine. It can also host lightweight services that do not need the GPU, such as uptime checks, reverse proxying, automations, and small databases.
Running it on a NAS can work, but be careful. If your NAS is also where models, backups, and generated outputs live, you may not want to stack every monitoring component on the same storage you are trying to observe.
For a small home lab, the best answer is usually: put Prometheus and Grafana on the always-on control machine, and run exporters on the machines being watched.
What to buy, and what not to buy
This is not a reason to buy a rack full of gear.
The most useful purchases are modest:
- a low-power mini PC if your GPU box should not be the always-on control machine
- a reliable SSD for metrics history and dashboard data
- a decent UPS if the lab already justifies one
- a small managed switch if you are already segmenting or organizing the network
- quiet fans or better case airflow if the dashboard shows real heat trouble
Do not buy another GPU because a dashboard showed one busy afternoon. Do not buy a new NAS because one output folder filled up. Do not buy a 10GbE network because a single graph looked dramatic during a model copy.
Use the dashboard to make smaller decisions first: clean outputs, move old models, adjust container restart policies, separate storage mounts, improve airflow, or stop running three heavy services on one mini PC.
If the dashboard repeatedly shows the same bottleneck during real work, then you have a better case for buying hardware. That is affiliate-ready content the honest way: the tool helps you prove what upgrade would actually help.
A practical first dashboard layout
Make one page you will actually look at:
Top row:
- AI box up/down
- GPU utilization
- VRAM used
- root disk free
- model/output disk free
Middle row:
- CPU load
- system memory
- GPU temperature
- network traffic
- Docker container status
Bottom row:
- Ollama or gateway check
- ComfyUI check
- Open WebUI check
- vector database check, if used
- recent target scrape failures
Keep the time range short by default, maybe the last hour or last six hours. You can always zoom out when investigating a slow drift. The default view should answer: "Is the lab okay right now?"
If you run multiple AI machines, make one overview dashboard and one machine-specific dashboard. The overview is for triage. The machine-specific view is for the fix.
Proofread your own dashboard
A dashboard can lie without being broken.
Common problems:
- the exporter is watching the wrong host
- Docker container names changed
- the scrape interval is too slow for short image-generation spikes
- the GPU exporter is not seeing all GPUs
- disk panels ignore the mount where models actually live
- service checks hit a reverse proxy instead of the real backend
- the dashboard stayed green because the check was too shallow
Before trusting it, make a few controlled changes. Stop a noncritical service and confirm the panel changes. Fill a test directory enough to see the disk panel move. Start a known GPU workload and verify that GPU memory and utilization respond. Restart a container and see whether the dashboard records the event.
This is the monitoring version of a recovery drill. You do not need chaos engineering for a home lab. You just need to know that the dashboard reflects reality before you rely on it during a late-night failure.
The payoff
A local AI health dashboard will not make your models smarter. It will not fix bad prompts. It will not turn a cramped one-GPU machine into a cluster.
It will do something more practical: it will shorten the time between "something feels wrong" and "here is the likely cause."
That matters more as your lab grows. One machine running Ollama is easy to reason about. One machine running Ollama, ComfyUI, Open WebUI, a gateway, a vector database, document OCR, prompt tracing, automations, and a pile of storage mounts is not. The more useful the lab becomes, the more boring visibility matters.
Build the dashboard while the system is still understandable. When the lab gets weird later, you will have a baseline, a history, and a calmer way to decide what to fix next.
Found something that needs correcting? Tell the editor. Research, estimates, and hands-on measurements should be identified in the article. Read our affiliate disclosure.